Backup for http://www.youtube.com/user/Materialworld4#p/u/4/Xz4pCXFtjo4
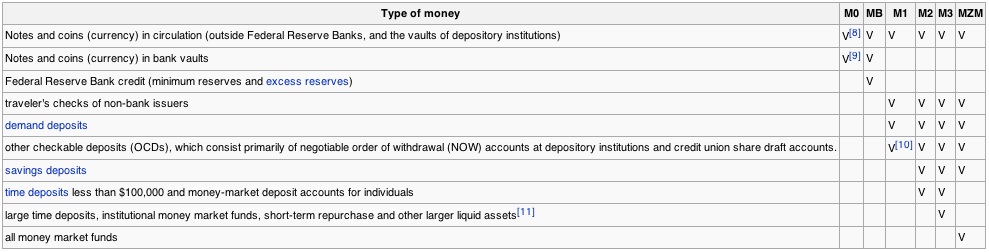
The Studios of FreedomPheonix.com with Ernest Hancock present Project Economy - Spring 2010 by Jack Gregson April 2010The sequence of graphs has been altered to present more of a cause-and-effect picture of the current economic debacle. Some were removed because they really don't add value. The money type chart was added for clarification. The text from separate presentation pages were combined to reduce space, and improve readability. Comments by Jack Gregson, Ernest Hancock [and Bill Holmes] have been added.
Credit Expansion and Contraction
The following Fed M-3 Money Supply Short Term Chart 2005 to 2010 chart disappeared from the Fed and has been recreated by NowAndFutures.com: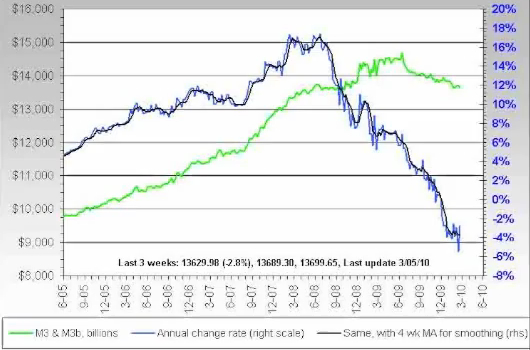
The Fed was adding about 13% annually to the money supply to create the tech bubble. [those-in-the-know were told to liquidate their marginal assets starting around 9/06 in order to be fat with cash when credit was tightened 12/06, so they could buy stock for nickels on the dollar.] Credit expansion resumed to create the housing bubble. [those-in-the-know were told to liquidate their marginal assets starting around 3/08 in order to be fat with cash when] the Fed severely contracted the money supply [in 6/08 to force businesses to decline so they can be bought for pennys on the dollar when the Fed again increases credit. Of course a few credit bumps are used to sucker hopeful investors into parting with even more of their assets on the way down. That's how the transfer of wealth game is played. While conservatives bemoan the transfer of wealth from "the rich" to "the poor" via welfare and other social programs, all Americans are having their pockets picked by bankers, which is why six banks now own assets worth 69% of the GDP and why the Rothschilds, who played this game long before Morgan and Rockefeller are worth an estimated $700 trillion. These inbred clans continue to birth even more Machiavellians.]
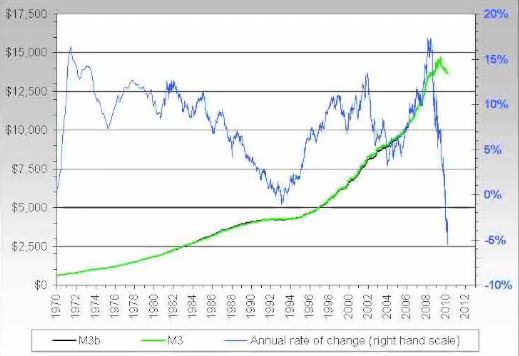
Fed M-3 Money Supply Long Term Chart 1970 to 2010, which shows the most dramatic drop in the 40-year history of the chart is occurring now as the blue line falls off a cliff as banks deposit their money with the Fed in exchange for interest.
M2 Money Stock:
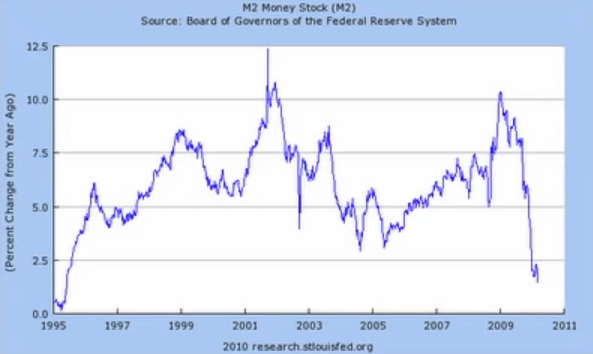
D. Rosenberg stated that the Fed M-1 money supply has contracted 4 weeks running. He also stated that the MZM money supply has contracted 4 out of the last 5 weeks (ZeroHedge.com 4/5/10).
Debt Expansion Due to Credit Contraction
Business loans from banks are contracting. Meredith Whitney has stated that credit lines will be cut by $2.5 trillion (CNBC winter 2009-10). US government securities at all commercial banks (USGSEC), Commercial and industrial loans at all commercial banks (BUSLOANS):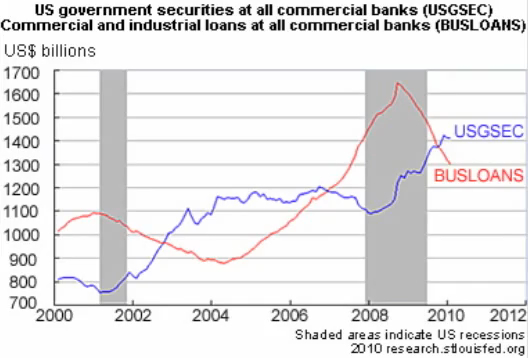
In 2009 the Fed bought over 80% of its own debt, because no one else would buy it. This is unprecedented.
In the second week of March 2010, the private Federal Reserve Bank (Fed) sold $154 billion in treasuries. The Fed has to sell $2 trillion in treasuries to cover the deficit. The Fed has to rollover $3 trillion in treasuries this year.
Federal deficit annualized 1993 to 2010 (Karl Denninger 4/4/10):
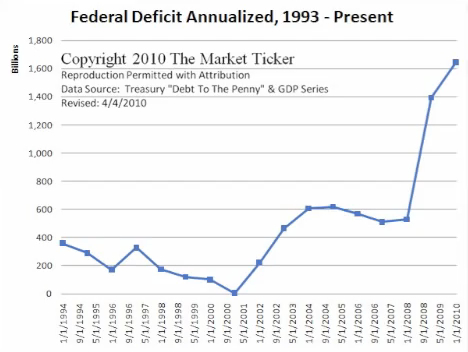
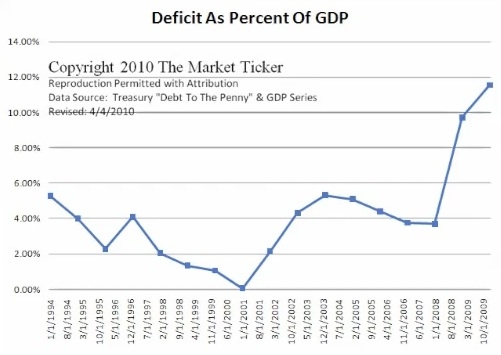
By the end of 2010 the Fed debt will be $14 trillion, but it cannot raise interest rates, so it is contracting the money supply. The Federal debt limit of $14.6 trillion may be reached by the mid-term elections in 2020. The Federal deficit as a percent of GDP (Karl Denninger 4/4/10):
Monthly US Treasury Net Insurance and Total Debt Outstanding Subject to Debt Ceiling (ZeroHedge.com April 2010):
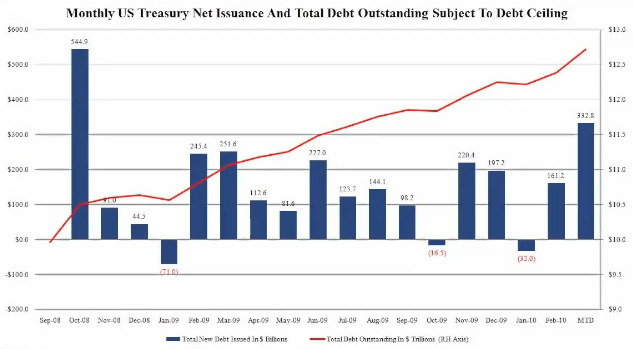
The Obama Administration spent $330 billion in February. In February the Budget deficit was $220 billion. Revenue for February was only $110 billion. Well over $5 trillion dollars in treasuries must be sold in 2010.
Notice how America's public and private debt burden 1920 to 2009 as a percent of GDP track the availability of Fed credit:
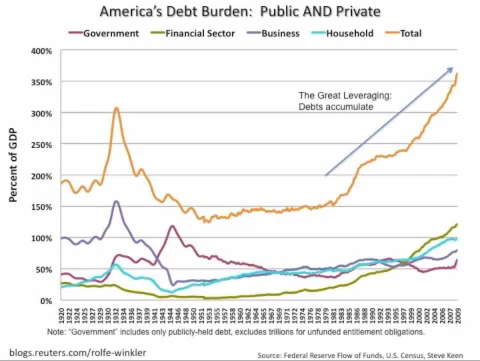
A true accounting of the national debt would be $12 trillion. The $5 trillion debt of FanniMac and FreddieMac won't hit the books until 2011, so even this graph is inaccurately optimistic.
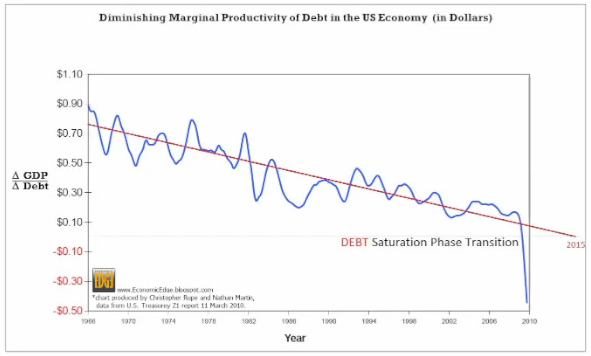
Every dollar of new debt in 1965 returned $0.73 in infrastructure and other things that contributed to the economy. Marc Faber reported that every dollar of new debt in 2010 returns a negative $0.60 [due to interest on our own money, or at least what passes as money paid to the private Federal Reserve stock holders]. The implications of a budget deficit of over $2 trillion in 2010 is the event horizon of the US financial black hole. A sovereign default of the United States, [its second bankruptcy] can no longer be avoided.
Unemployment Due to Debt Expansion and Credit Contraction
Commercial and Industrial Loans at All Commercial Banks: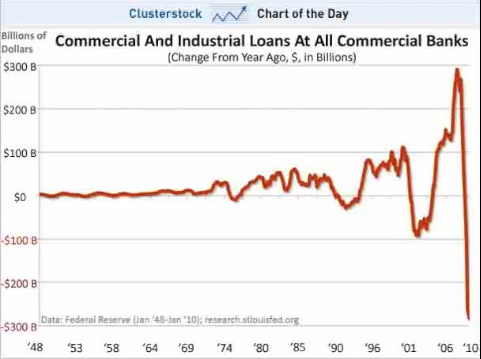
[With the debt load due to credit expansion, no economic growth commensurate with the growth of the money supply, because it was artificial, and the difficulty of getting new loans due to the credit contraction, businesses stopped expanding, and started firing.]
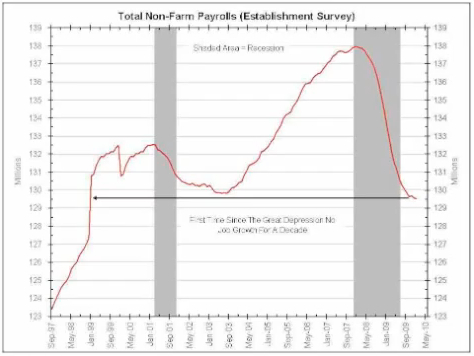
Total non-farm payrolls 1997 to 2010:
This Employment to Population Ratio - All Time, Men and Women 1948 to 2009, chart shows women and baby boomers entering the workforce. Baby boomers started to work in 1964. Unlike Rosie the Riveter during WW 2, women started to permanently enter the workforce in the late 1960s. Recessions are clearly visible as downturns in the participation rate. [These Fed credit cycles transfer wealth from labors to Fed friends with each cycle.]
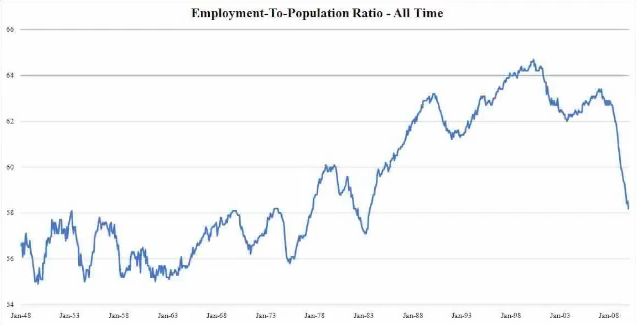
Fifteen years worth of jobs have been lost.
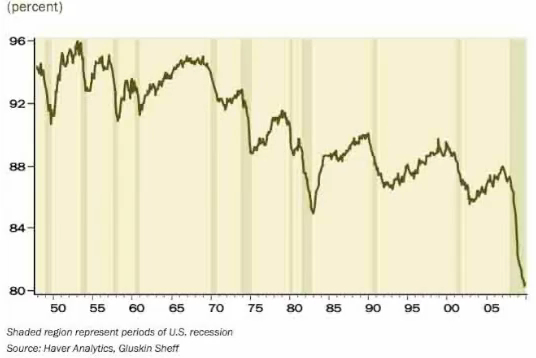
Employment to population ratio of men age 25 to 54:
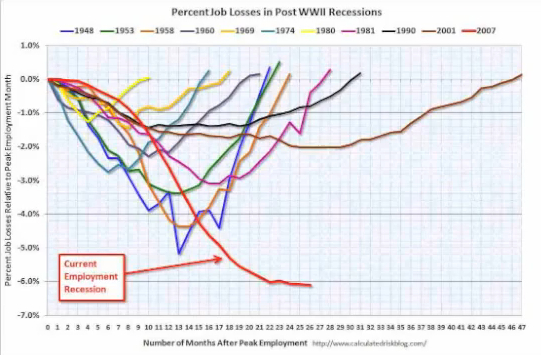
Percent Job Loses in Post WWII Recessions:
The Bureau of Labor Statistics (BLS) severely under reports the level of unemployment by emphasizing line U-3, which stands at 9.7%, whereas line U-6 is a much more accurate measure of unemployment. Line U-6 has been around 17% for months. John Williams of ShadowStats.com reports unemployment is over 20%, because the BLS Birth Death Model software program, which estimates small business job growth, added millions of fictitious jobs in 2007 to 2010.
Fictitious jobs by month in 2009:
February 134,000
March 114,000
April 226,000
May 220,000
June 185,000
July 32,000
August 118,000
Fictitious jobs by month in 2010:
February 97,000
March 81,000
In the past nine years a lot of important information, like the Fed M-3 money supply charts in March 23, 2006 has simply disappeared. Information concerning programmed trading on wall street disappeared last summer. The BLS will start withholding some data shortly. The 39-country international copyright treaty, which Bush and Obama classified as Top Secret will greatly accelerate the reality of information segregation. Leaks indicate it has a three-strikes clause. Three copyright violations and your entire family will be banned from the Internet by your ISP.
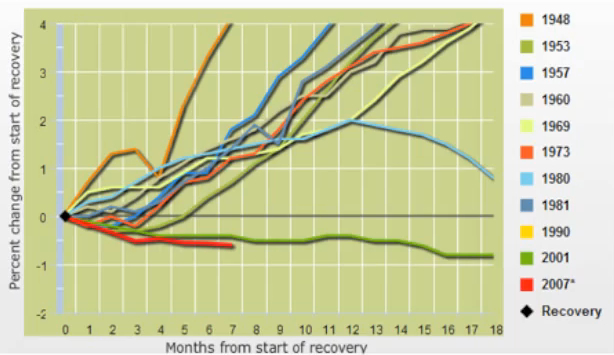
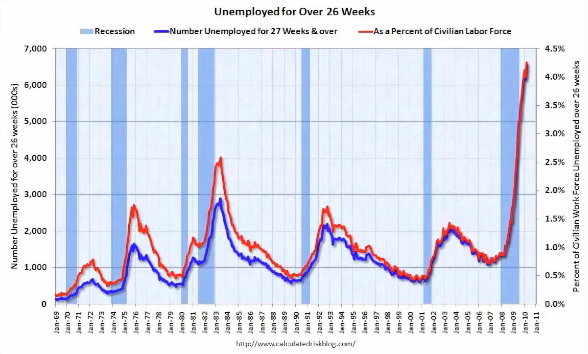
Unemployment in economic recoveries 1945 to 2010:
Long term unemployed increased by 414,000 last month to 6.5 million people. Number unemployed over twenty-six weeks:
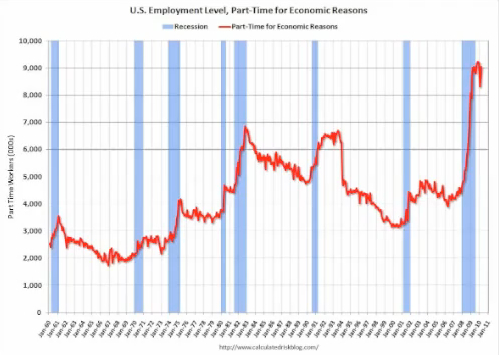
Involuntary part-time employment increased by 738,000 in 60 days. US employment level, part-time for economic reasons:
[Unless the unemployment compensation extensions are extended,] millions will cease receiving benefits in June.
The last decade had no discernible increase in jobs. To keep up with normal population growth, 130,000 to 150,000 jobs must be added to the economy each month. 75 to 80 million baby boomers were born between 1946-1964. By 2005 to 2006, the leading edge of the baby boomers. Their peak earning years coincided with the peak of the housing bubble. This is the first time this has happened since the Great Depression.
News: "Incomes drop for the first time in 40 years."
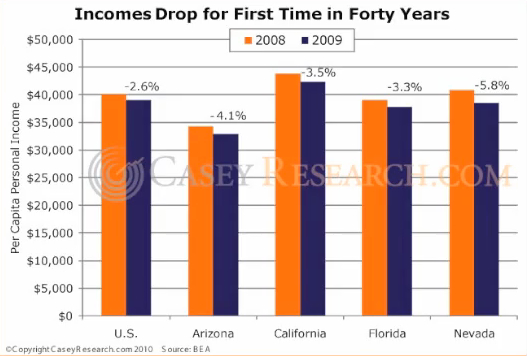
Because of the effects of war arbitrage, globalization and the Internet, millions of high-paying jobs will never return. As the baby boomers age, many are expected to fall into poverty and become homeless. The rate of elderly people who are homeless is expected to soar by 2020.
Household net worth 2000 to 2009:
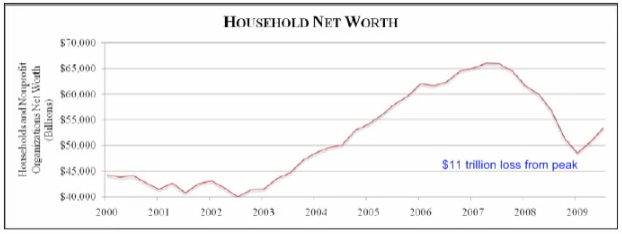
The peak earning years of 75-80 million baby boomers were 2005 to 2006, which coincided with the housing bubble. The increase in 2009 is due to S&P, DOW and NASDAC rising from their lows in 2008. [The Fed credit contraction was perfectly timed to use this demographic to exacerbate the economic downturn.]
Social Security ran a deficit several months last year. According to a report last month, Social Security has seen a drop of 9.3 million people paying into the system. They have disappeared from the job market. Social Security also experienced a funding reduction of 5.84% in the first two months of 2010. Social Security is hitting a fiscal brick wall 10-17 years earlier than foretasted.
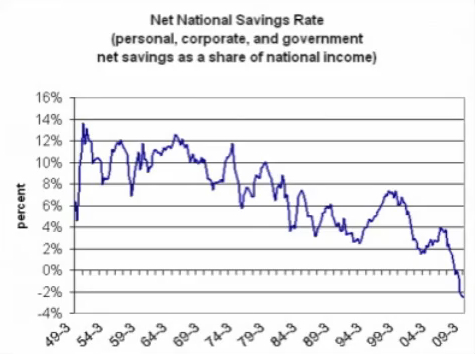
US savings rate 1949 to 2009 shows the drops as people try to keep their homes or otherwise survive after being unemployed.
More Unemployed Means Less Income for Government
Federal Government rolling twelve-month individual and corporate income tax withholdings (net of refunds) 8/08 to 2/10: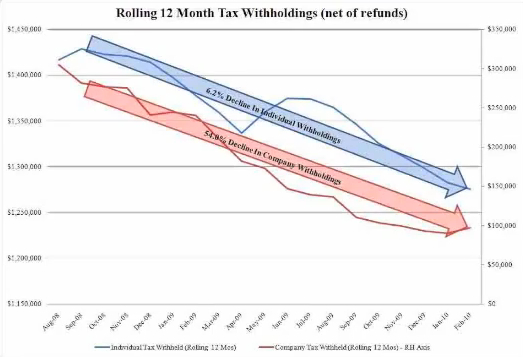
Federal monthly individual (blue) and corporate (red) tax withholding (net of refunds) 8/08 to 2/10:
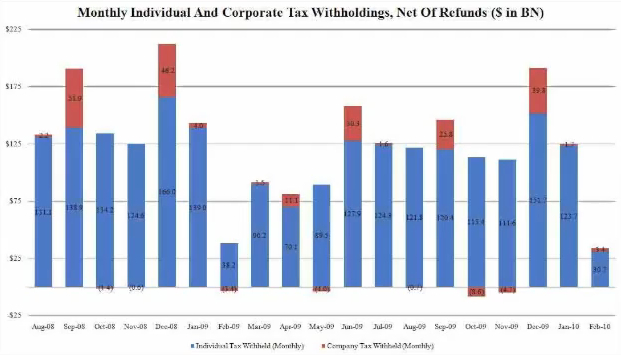
Clearly the economy is getting worse, not better as alleged by government.
Note the State budge gaps in the following web page of "Insolvent European Countries vs American States":
California 22.0% (6th largest economy in the world)
Arizona 19.9%
Florida 19.9%
Nevada 16.0%
New York 9.8%

Meredith Whitney of Meredith Whitney Advisers has stated that State and Local governments are 12% of US GDP, and their budget deficits will be in the range of $500 billion to $2 trillion dollars, and will be worse next year.
Personal income tax receipts by state and local governments 1960 to 2010:
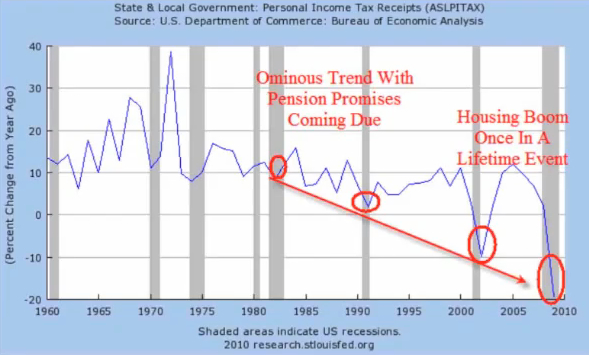
The City of Los Angeles will run out of money by May 6th, 2010. California is the sixth largest economy in the world. It has a $22 billion budget gap. Within the past several weeks, California has laid-off over 23,000 teachers. It has a $500 billion pension fund time bomb. Thousands of prisoners will be released due to lack of funds. The vast majority of States will make drastic budget cuts.
One of the conditions of the Stimulus Package was that State and local government had to keep their employees on the payroll a certain time, so expect more layoffs after July of 2010. Add these people to the unemployed who deplete their savings to save their homes only to be foreclosed upon and demand government services.
Government Income Decline Is Exacerbated by Increase in Demand for Services
Food stamp participants 1969 to 2009, with 1.2 million people added in the last two months: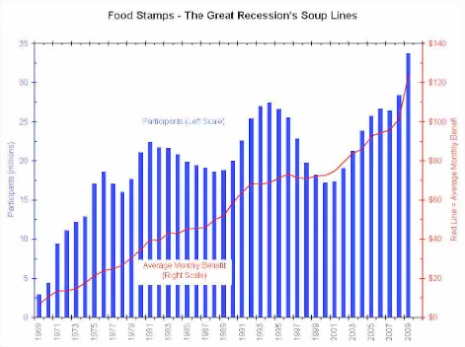
Food stamps now used by 39.4 million people as of 4/6/10 according to GlobalEconomicAnalysis.blogspot.com, which is a 22% increase in one year. By State, the largest increases are
Nevada 46.9%
Idaho 45.7%
Rhode Island 42.4%
Wyoming 40.0%
Wisconsin 38.6%
Florida 38.6%
Utah 37.3%
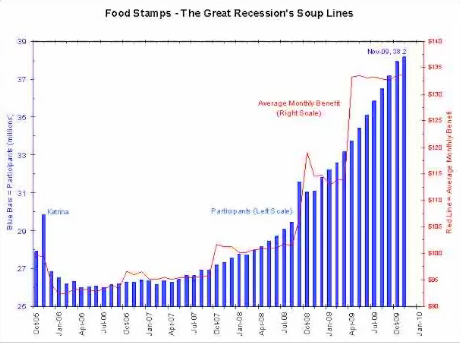
Food stamp participants 2005 to 2010:
As Income and Savings Are Lost, Bills Cannot Be Paid and Items Cannot Be Bought
Capital One Financial Annualized Credit Card Net Charge-Off Rate (credit cards not being paid):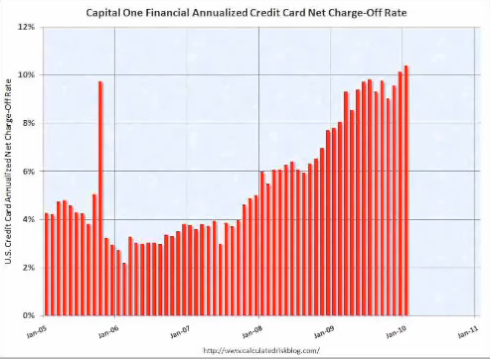
This is a 10% charge-off rate. Some banks are experiencing 16%.
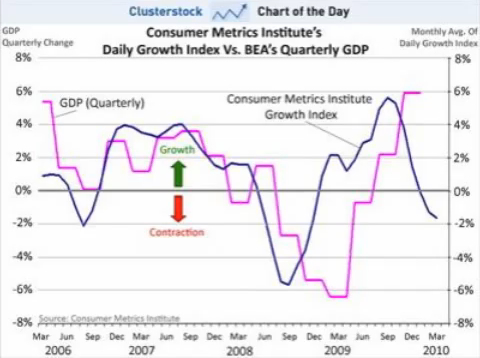
The economy may have already entered a double dip recession. The blue line indicates we may start to see the economy contract into the next leg down of this depression.
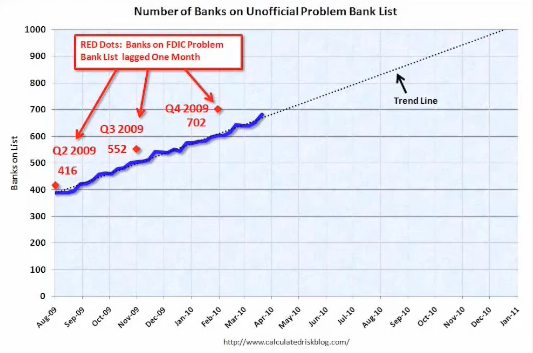
The Problem Bank List has grown 68% since August 2009. About 6,000 branches have closed.
Monthly Commercial Mortgage Backed Security (CMBS) Delinquencies:
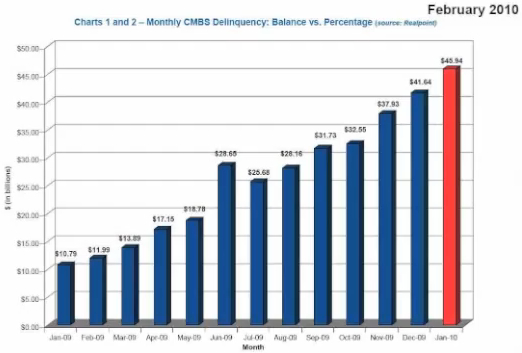
Commercial Real Estate value has declined 42%. Bank stocks and financial stocks soared when the accounting rules were changed last spring, so the banks would not have to recognize their losses until they sold their asset. The book value of the assets carried is a fantasy, which has also been called "extend and pretend," or the biggest fraud ever committed on the American public.
On April 2, 2009 the key FASB Rule 157 was suspended. It governed the marking of assets, the so called "mark to market" rule. By suspending this rule, none of the banks have to admit that they are insolvent. William Black played a huge role in the cleanup of the late 1980s savings and loan disaster. He stated that the FBI has 1/6th the number of agents needed for white collar crime that they had for the savings and loan disaster, but the problem is several hundred time larger. he further stated that there had not been one prosecution.
Bank and Thrift Failures Per Year 1934 to 2010:
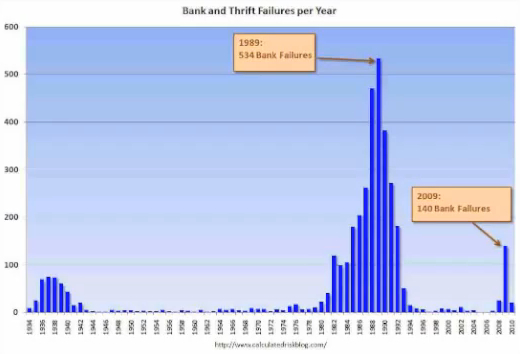
The auditors of the TARP fund, Elizabeth Warn and William Black say 3,000 community banks are insolvent or close to it, and on the verge of failure in the next two years. That is about 40% of the banking system. The FDIC has a deficit of about $20 billion. There is no money to cover bank accounts of $250,000 [without further borrowing from the Fed]. Unless the FDIC only closes small banks, a few at a time The FDIC does not promise you how soon you will get your money back. It could take months or years, or never, depending on the depth of the crisis. The FDIC is pulling dues from the banks forward by several years. The FDIC has $500 billion it can draw in an emergency, but this fund would have to be approved by Congress, and would send shock waves through world markets.
The Fed is considering reverse repossessions, and drawing money from money market funds and 401Ks. The Obama administration considers $2 trillion in pension funds to be a ready source of funds to invest in dead banks [after ownership has changed to be JP Morgan or one of the other six banks who have accumulated assets worth 69% of the USA GDP]. An Executive Order may be sufficient for the act.
With the bankruptcy of GM and Chrysler, contract law was under direct assault. A debtors positioned line was determined not by the law, but by political influence. In other countries this is called Crony Capitalism. Here we call it American Enterprise. The Rule of Law was to be replaced by the Rule of Men.
William black is the author of "The Best Way to Rob a Bank Is to Own One" stated in an interview last week, "It's as if you took your kids, when they were teenagers, and when they did something outrageous that would hurt people, you tripled their allowance instead of punishing them. You turn out psychopaths and sociopaths. We now have sociopaths in control of our major financial institutions and important levers of government as well."
Number of FDIC Insured Problem Institutions
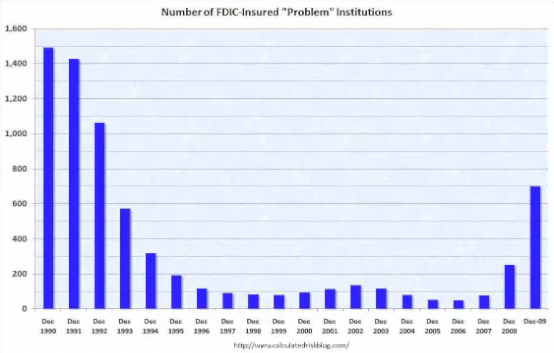
There are now 641 to 702 problem banks on the cusp of going under. The FDIC cannot close them any faster than they are, because there is no money to insure those deposits.
FDIC chairman Sheila Bair has refused to use a powerful tool at her disposal: USC 12 Chap 16 Section 1831o, known as Prompt Corrective Action. This could be used to close large financial institutions that are insolvent. Ask yourself why.
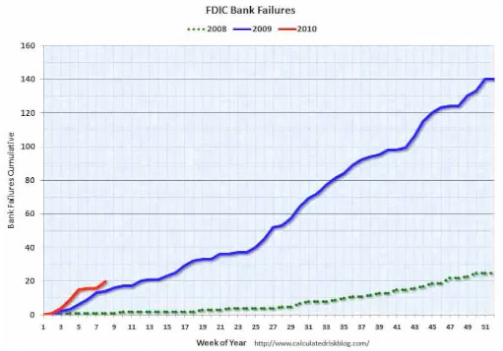
FDIC Bank Failures 2008 to 2010:
Other Indications of Continuing Economic Decline
Average Weekly U.S. Rail Carloads 2006 to 2010: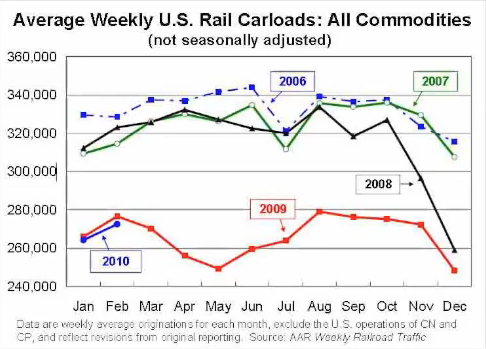
Rail traffic has increased 8% over the last several weeks, but was down 1.5% in February (not shown in chart) and will likely continue to decline due to the fundamentals.
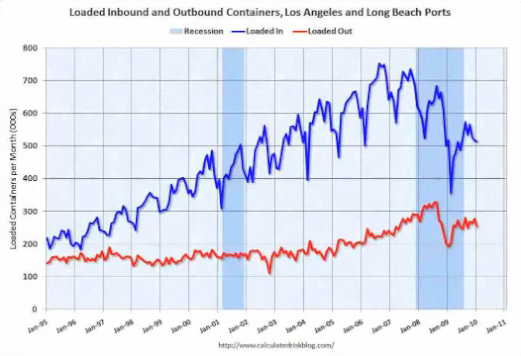
Loaded Inbound and Outbound Containers Los Angeles and Long Beach Ports 1995 to 2010:
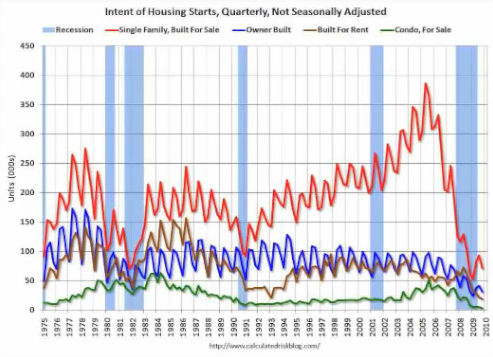
Intent of Housing Starts Quarterly 1975 to 2010:
U.S. Population Distribution:
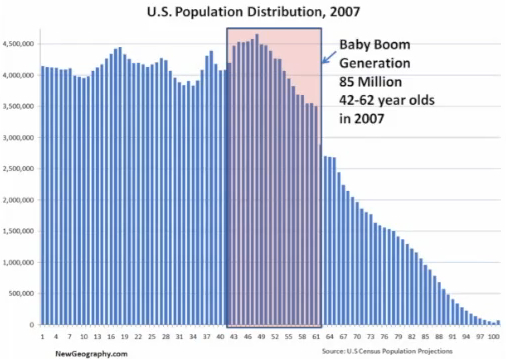
MacMansions are no longer wanted. Baby Boomers will be net sellers of Real Estate to fund their retirement.
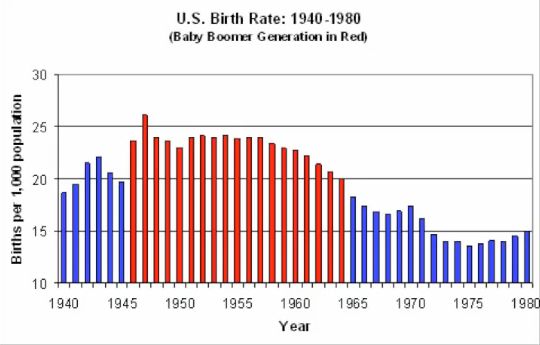
U.S. Birth Rate 1940 to 1980:
U.S. Liver Births Per Year 1905 to 2002:
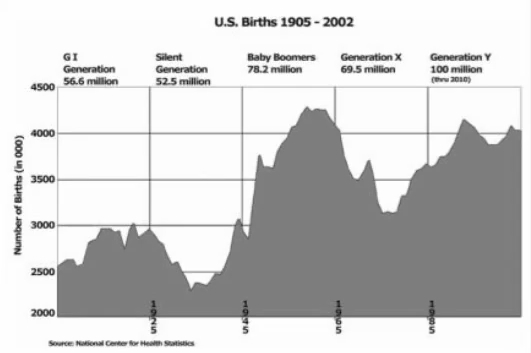
Generation Y largely exists due to legal and illegal (anchor baby) immigration.
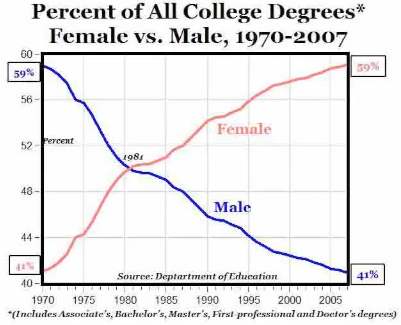
Percent of All College Degrees, Female vs. Male, 1970-2007:
Existing Home Sales SAAR 1994 to 2010:
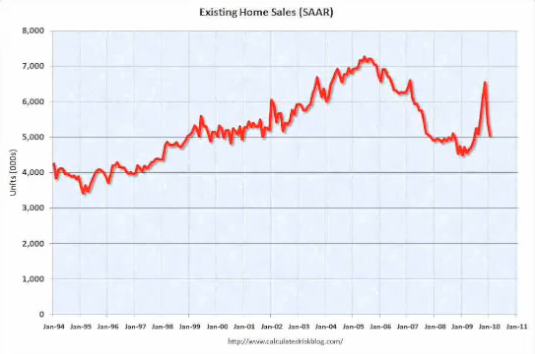
$8,000 home buying credit for first time home buyers stimulus did not last long.
New Home Sales and Recessions 1963 to 2010:
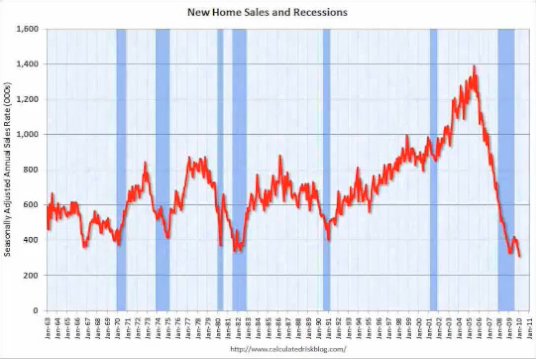
[Credit peaked and] Home buying peaked during the peak earning years of the baby boomers. In this graph the stimulus is less pronounced.
Case-Shiller Index History of Home Values 1890 to 2010:
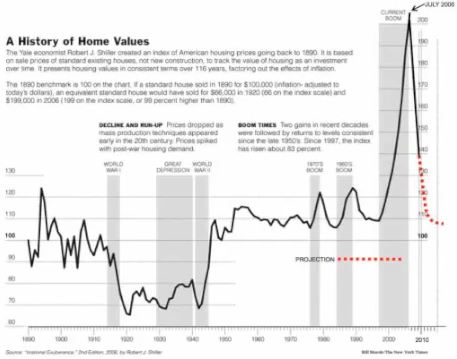
The long term trend line was 2-3% increase in housing prices over 120 years. Government subsidies, Option ARMs, Interest Only loans, etc. were used to panic people into homes.
Case-Shiller Composite Indices 10 City Composite and 20 City Composite 1987 to 2010:
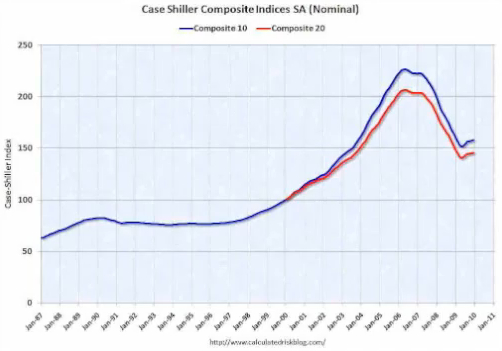
Case-Shiller Cumulative Price Decline from Peak, 2007, 2008 and 2009
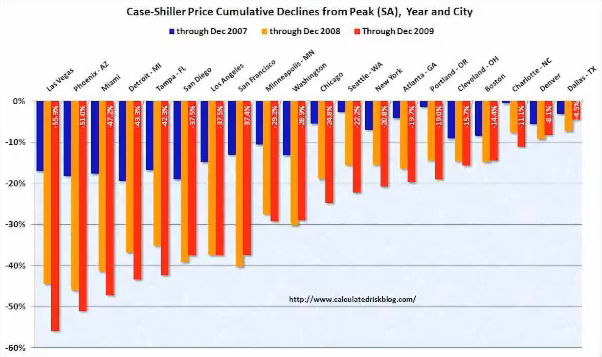
The farther the house prices rose, the harder they fell.
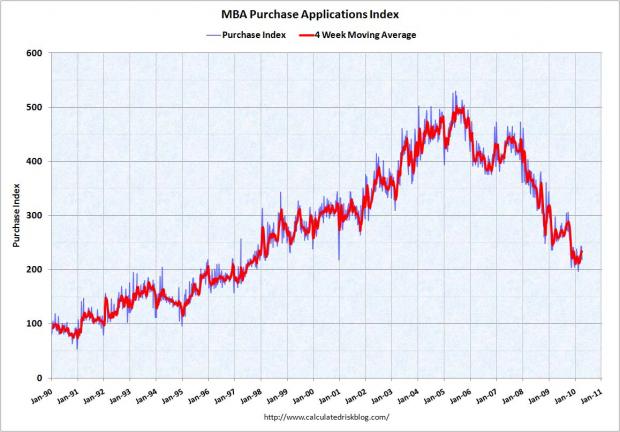
The Market Composite Index, a measure of mortgage loan application volume, decreased 9.6 percent on a seasonally adjusted basis from one week earlier. ..."Applications for government mortgages dropped substantially last week, following the implementation of an increase in FHA mortgage insurance premiums," said Mike Fratantoni, MBA's Vice President of Research and Economics. "Applications for conventional mortgages also dropped last week, with refinance application volume continuing to drop following last week's jump in rates.”
Household Percent Equity 1952 to 2010:
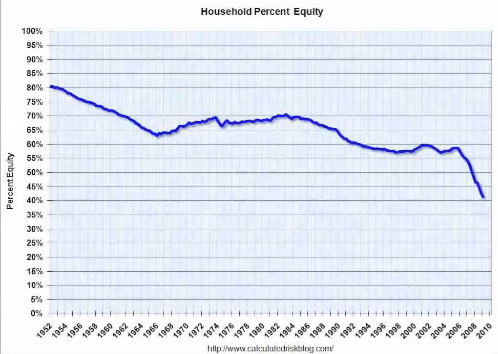
Rosie the Riveter paid-off her house by the end of the war. By 1952 most home owners owned the bank 20% of the value of the house. By 2008 it's 50/50. By 2010, 60% is owned to the bank.
Percent Homeowners with Negative Equity by State:
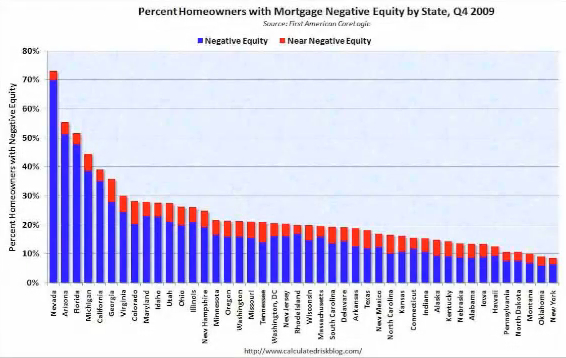
This includes 23 million who actually own their homes (no loan).
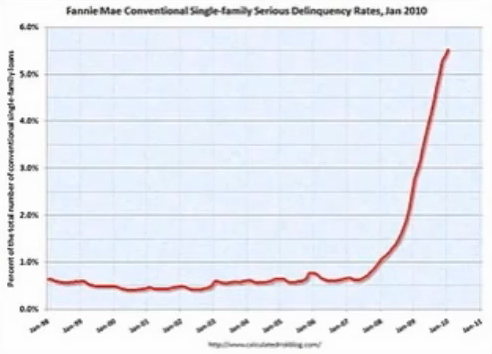
Fannie Mae Conventional Single Family Serious Delinquency Rates January 2010:
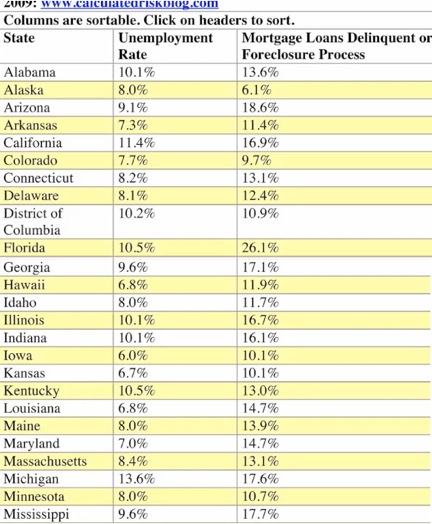
Mortgage Loans Delinquent or in Foreclosure by State (calculatedrisk.com):
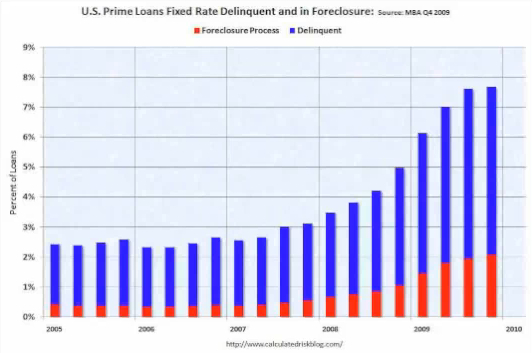
Prime Loans Fixed Rate Delinquent and in Foreclosure 2005 to 2009:
Option ARM Adjustable Rate Mortgage Resets by Loan Type in Billions 2010 to 2013:
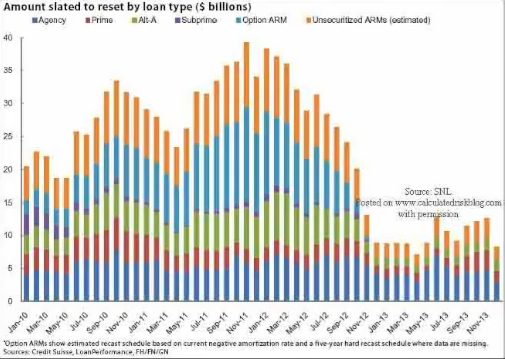
Many are 5-year balloon payments due 2010 and 2011.
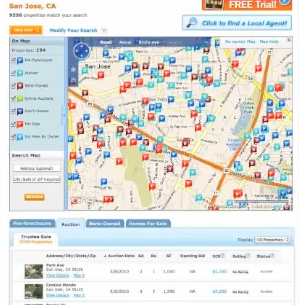
RealityTrac.com, San Jose, California foreclosure map for multi-million dollar homes:
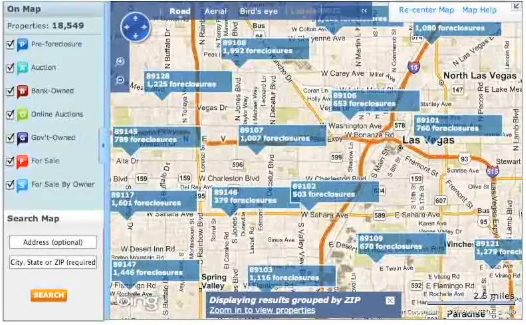
Las Vegas:
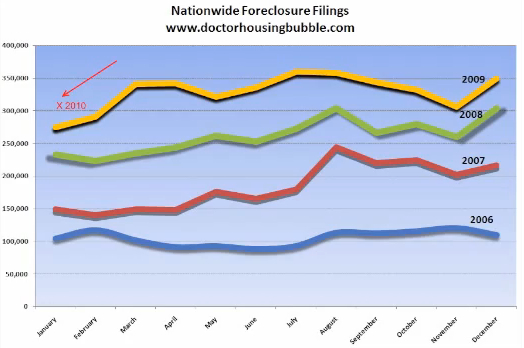
Reality Trac expects 4.5 million foreclosures in 2010; up from 2.9 million foreclosures in 2009.
Foreclosures by year 2006 to 2010:
By the time the Fed is done contracting credit, houses, businesses and banks will be nearly free for the taking, but only those-in-the-know will have the cash to take advantage of it. After those-in-the-know have converted their cash to hard assets, the Fed will inflate the money supply to start another bubble, and get everyone back on the treadmill creating wealth for those-in-the-know to take during the next bust. In the process, the value of their savings will be destroyed with inflation.
The assets of the top four banks now represent half of the US economy.
